ScoreCard - Reveal Your Network's Score
Procera’s Network Scoring Solution provides a ScoreCard view that gives operators an understanding of what quality their network is capable of delivering.
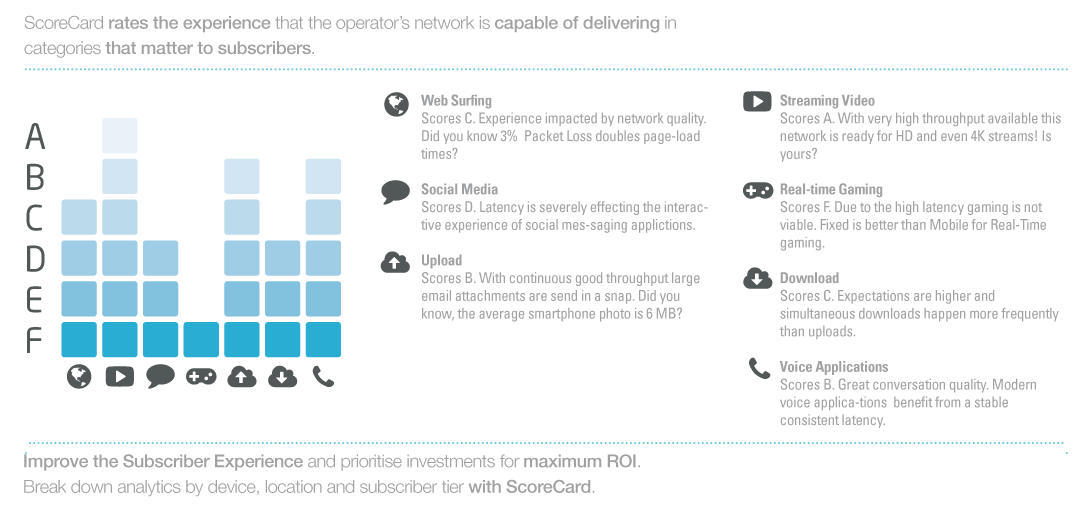
Networks are rated from A to F in categories that subscribers care about: Web Surfing, Streaming Video, Social Media, Real-time Gaming, Upl oad, Download and Voice Applications.
Prioritize network investments.........gain maximum subscriber experience impact..........increase ROI
CommsDay 2016, Sydney Monday 4 April 3.55pm
Come and hear Thomas Vasen, Procera’s Subscriber Experience Evangelist, talk about
Fighting back against the ISP scorecards
Tim Hermes
Group Publisher of Broadband Technology Report
"A 4.5-Diamond score is a nearly-perfect rating.....The judges were obviously bowled over by the ScoreCard's capabilities."
Who has the best network?
Customers are asking “Who has the best network” and “Who delivers the best subscriber experience” however how does an operator accurately measure their network quality, much less a subscriber.
As higher bandwidth and volume service plans are being offered to consumers, network operators are struggling to cope with the flood of video traffic and the high expectations for network performance for social networking, gaming and VoIP.
Over-the-Top video providers like YouTube and Netflix have begun to rate operators with their own Speed and Performance indexes, and consumers are using services like Speedtest to make snap judgments on the performance of an operator’s network that may bear no resemblance to the normal service offered; note that many broadband providers ensure that anyone running a performance measure like Speedtest will receive the highest possible service.
Unfortunately for operators (and subscribers), speed tests and network KPIs do not show the subscriber experience; a subscriber and application perspective is needed.
This is where ScoreCard comes in......
ScoreCard from Procera
Procera’s Network Scoring Solution provides a ScoreCard view that gives operators an understanding of what quality their network is capable of delivering. Networks are rated from A to F in categories that subscribers care about: Web Surfing, Streaming Video, Social Media, Real-time Gaming, Upload, Download and Voice Applications.
A score is given to each category, based on the throughput, latency and packet loss measured. Procera has developed a scoring matrix that provides a score for each category based on current application needs, and the scoring matrix will be updated yearly. The data can be captured anywhere in the network, minimizing the number of measurement locations needed for a network-wide deployment.
When combined with a selected Perspectives, the scores can be filtered by device type, location (such as Cell ID or DSLAM), and subscriber-tier. The visualization in Insights includes a breakdown of where and/or what is causing a low score, and where investments should be made to improve the overall network or application score using Procera’s playbook. The Scores are saved per Perspective based on the peak hour, enabling historic visibility of how the quality capability evolves over time during peak usage.
Procera Networks delivers a unique solution with ScoreCard that drastically simplifies the measurement of the Subscriber Experience
ScoreCard Value Proposition
See imperfections in your network
Monitor subscriber experience and ensure high value customers are receiving a high Quality of Experience.
Gain executive insights
Present the quality your network is capable of delivering in an easy to understand graphical overview.
Improve user experience
Avoid churn based on subscribers or group consistently receiving bad scores.
Make informed investment decisions
Predict network congestion and CAPEX needs based upon the locations identified as low scoring.
Call to discuss scoring your network.....
Understand your subscriber's experience
ScoreCard Solution Components
The Network Scoring Solution is composed of several mandatory and optional components
that add value to the overall solution.
PRE Platforms
The PRE (PacketLogic Realtime Enforcement appliance) acts as the collection engine on the network for gathering the subscriber experience scoring data. For the network experience scoring solution, the PRE can be deployed in either a passive or active mode to collect the scoring metrics.
The PRE can also be deployed as either a virtual or a packaged appliance from Procera. The PRE will inspect all subscriber traffic on the network and stream it to the Insights database for visualization.

Subscriber Perspective

Click on the Image to Download the Datasheet
Subscriber Perspective is the integration point with the BSS/OSS to glean subscriber-specific information to associate with each flow on the network. With Subscriber Perspective, each subscriber is associated with their IP address, service plan, location, device, and other information available in the operator’s OSS and BSS. This data is crucial to Scoring, since the subscriber is the fundamental measurement basis for the solution.
The Score Perspective measures active subscriber traffic to create the subscriber’s score.
Score Perspective
Score Perspective measures each subscriber’s throughput, latency, and packet loss at sub second intervals to gauge the ability of the network to deliver a high quality experience to the subscriber. The scoring reflects the performance during peak usage applied to the expectations for each application class - Web Surfing, Streaming Video, Social Media,Real-time Gaming, Upload, Download and Voice Applications. The measurements include location, device, and service plan to provide context for each subscriber’s traffic if available from other deployed Perspectives. Score Perspective measures active subscriber traffic to create the subscriber’s score.

Click on the Image to Download the Datasheet
Traffic Perspective

Traffic Perspective is based on Procera’s industry-leading Datastream Recognition Definition Language (DRDL) DPI engine, and provides visibility into the applications running on the operator’s network. Over 2,500 unique applications are included like Messaging, VoIP, Video Streaming, Audio Streaming, File Sharing, Gaming, and many other categories of applications.
Traffic Perspective guides the operator on the application types that they should focus on improving their Score for based on subscriber usage patterns.
In addition to the mandatory components listed above, the following options provide extra functionality:
- Topology Perspective - Integrates the subscribers location with their traffic for fixed, mobile or WiFi networks.
- RAN Perspective - Adds the exact cell location in real-time for a mobile subscriber as well as the RAN Signal Strength and Quality for the subscriber’s device.
- Device Perspective - Device Perspective is a mobile-centric perspective that adds device-specific information (brand, type, screen size etc) for each subscriber. Device Perspectives can help identify if a specific device type is causing a low network score.
- Engineering Insights - A visualization and decisioning platform designed specifically for Engineering and Network Operations with drill down capabilities.
- Executive Insights - Visualizes the overall ScoreCard for the network, traffic, devices, and subscribers. It is tailored to meet the needs of an operator’s executive management by summarising the network status into an easy to understand ScoreCard


Big Data Integration
Procera Networks provides excellent Big Data Integration by combining the best available subscriber experience intelligence with real-time access to that data. Procera’s unique combination of business and subscriber experience metrics enables advanced Big Data use cases:
- Network Quality Assurance – Monitor the subscriber experience and ensure high value customers are receiving a high QoE
- Service Creation - Target service offerings where your network delivers a high Score.
- Customer Care - Use a subscriber’s Score to determine what issues they may have experienced.
- Executive Dashboard - Present network status and performance to Executive Management in a simple, easy-to-understand GUI.
- Network Planning - Predict network congestion and CAPEX needs based upon potential revenue loss from high value subscribers.
- Churn Prediction - Predict churn based on combinations of Perspectives, i.e. Bad QoE and customer care contact.
Resources
- Videos
- Datasheets
- USE CASES
- White Papers ETC

White Papers
Other Docs

Maser’s NetworkiQ range helps our customer’s manage their networks more intelligently to reduce operational costs, increase revenues and provide a better and safer user experience. This is achieved through better visualisation, optimisation, monetarisation, testing and threat mitigation. Our NetworkiQ partners are leaders in subscriber awareness, intelligent policy control, transparent caching, energy efficiency, expense management, subscriber services, security and optical switching.
Maser NetworkiQ is part of the Maser Group who partner with leading international vendors to provide innovative solutions and services to the Australian, European, New Zealand and Pacific Island markets. Click on the following links for further information on:
- Maser Technology Group for telecommunications solutions
- Maser Defence for defence, humanitarian and government solutions
- Maser Communications for specialised cable solutions
- Maser Energy Efficiency for Intelligent LED lighting and voltage optimisation solutions
NetworkiQ Partner:
- WeDo - Business Assurance including Data Retention
- Aizoon - Advanced Persistent Malware Detection
- SevOne - Complete IT Infrastructure monitoring
- Procera Networks - Internet Optimisation, Analytics and Monetarisation
- PeerApp - Transparent Caching to reduce costs & improve QOS
- TSA - Telecommunications Expense Management
- Tollshield - Fraud and revenue protection
For further information about Procera or Maser's NetworkiQ range
please contact:
Kevin Redmond
T: 0410 535 845
E: [email protected]
Maser Telecommunications Group Pty Ltd
Unit 9, 15B Rodborough Rd
Frenchs Forest NSW 2086
Australia
www.maser.com.au
T: (02) 9452 6062
Copyright 2015. All Rights Reserved
You have read this far....why not find out more?
Contact Kevin Redmond on 0410 535 845 to discuss....